
This past week we installed a mini split system in the Blue Skies cabin. You can read about the gory details if you have insomnia and need a cure over at this creatively named “Installing A Mini Split In An Off Grid Tiny Home” post. Once we got the system up-and-running I was surprised by how quickly the heating consumed the battery capacity. After gathering some data and thinking about it on the drive home, I realized something — the “math wasn’t mathing”. A little bit of math gymnastics in my head on that drive and the “Ah Ha Moment” came — my math was off by a factor of ten. Then the BIG “you dumb ass” moment — 120V is 10x 12V.
I did the math wrong.
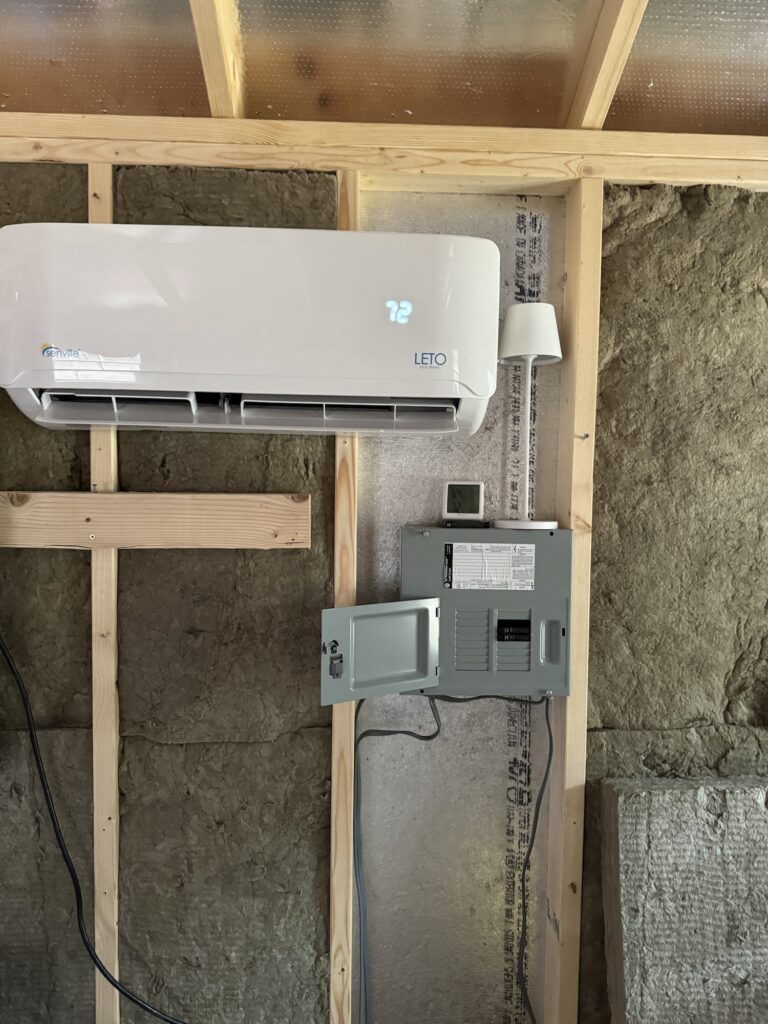
The Senville Leto mini split runs on “120V” AC and the manufacturer says it consumes 7 amps. Yeah, 7 amps at 120 volts.
Diving Into Solar Power Math
Solar Power Math is basic math related to electrical power with some special considerations added along the way. Let’s start out with some very basic math that is used in electrical systems. The first most basic formula to remember is the relationship between watts, amps, and volts. I remember this with the moniker “Wave”:
W = A * V
Watts = Amps * Volts
With this basic starting formula we can start doing calculations and comparisons throughout out solar power system.
Let’s define what these are…
Watts (W)
A unit of measure that tracks how much energy (work) is generated, stored, or consumed in and electrical system.
Typical measurements include the time element with the default being “hours” as in “Watt Hours”. This is why your electric bill from an on grid company is charged in “kWh” or Kilowatt-Hours. A Watt-Hour (or Kilowatt-Hour) is a measure of how much energy you used. Thus a Watt-Hour could be compared to a “gallon” of a fluid.
You can use Watts to compare the storage capacity of something like a battery or how much energy one thing uses versus another. The period-of-time , an hour in our example above, is dropped when talking about the storage capacity or consumption of something. This is why old-school incandescent light bulbs are listed in “Watts” as in a 60 watt bulb or a 90 watt bulb. You can compare how much energy they consume without the time measurement.
A 90 watt bulb will consume 50% more energy than a 60 watt bulb when used for the same amount of time; 1.5 watt-hours for a single minute of use for the 90 watt bulb ( 90 watts in an hour / 60 minutes) versus 1 watt-hour for the 60-watt bulb.
Amps (A)
This measures how fast the electricity is moving in the circuit. It is a measure of how many electrons pass a single point in a given instance.
Like watts, it is usually combined with a measure of time when talking about things like generation, storage, or consumption and follows similar principles. A device consuming 20 amps eats up twice as many electrons as a device consuming 10 amps , assuming voltage is the same for both devices.
Remember from our W=A*V equation above, amps and volts have a very close relationship so if we want “all things to be equal” when doing comparisons we want to ensure that when we compare devices that the volts are the same first.
Volts (V)
This is the measure of “pressure” in an electrical circuit. It is described as the amount of force used to move the electricity through the circuit.
Personally I find this confusing when talking about the relationship between watts, amps, and volts in the circuit.
If watts is “the total amount of electrons a device ate” let’s say 1,000 in an hour = 1,000 wh…
And amps is “how many electrons we ate each instance, let’s say 100 per hour = 100 ah…
Then volts would be 10 (per our W = A * V , that means to calculate volts from the above would be W / A = V so 1,000 wh / 100 ah = 10 volts).
My Version of Defining Volts
Based on our description those 100 electrons were pushed 10x harder, but why does not hard it was pushed make a difference on how many total electrons we ate? (The deeper theory I get, the force pushing something is also a measure of energy – the electron-volts at an atomic scale, but let’s not get that deep here).
Instead of “force of push”, I like to thing of volts as “how many lanes we have” to eat up those electrons and the amps as how many electrons pass by each instance on each lane. So if you have 10 “lanes” (10 volts) with 100 electrons going by on each lane every hour (100 ah) then the total electrons that end up “in the bucket” or “eaten by a device” would be 10 v * 100 ah = 1,000 wh.
Some people don’t like the “lanes” or “bandwidth” examples for volts, so many a closer analogy might be the “size of the electrons” with 10 volt electrons being 10x bigger than 1 volt electrons which may be easier to visual as the extra “push” or energy stored in each electron… almost like a bigger inflated water balloon.
Enough with the basic math, back to our Solar Power Math and how it impacted our mini split calculations.
Defining Our Real-World System Using Solar Power Math
Ok enough of the boring science stuff. Let’s talk about our real-world experiments and what we learned and how to do the math. We will talk about power generation (the solar panels), the charge controller that “does the math and wrangles electrons using that math”, the battery storage, “changing the math” with the inverter, and eating those electrons with the mini split.
Solar Power Generation Math
Solar panels generate the power and have a few key metrics.
Most people quickly learn solar panels are rated in watts. How much power they generate in a perfect environment.
No environment is perfect. So the first lesson we learned in our real-world measurements, on a great day with full sun in the summertime with proper panel inclination pointed straight at the sun you might get slightly more than 50% of the power out of the panel. The watts only matter to compare how much potential a panel has , much like compare those old light bulbs to decide which is brighter (a 90 watt is about 1.5x brighter than a 60 watt and consumes 1.5 times the power… kind of but this is not a science article on luminance and lumens).
For the solar power math there are two key metrics you want to look at on a single panel as it will determine how you wire things up. Those two items are the optimum (perfect day) voltage and optimum amps.
Our 100W Renogy Panels put out 20.4 volts and 4.91 amps (20.4 v * 4.91 a = 100.164 w).
Sidebar : most electrical systems work more efficiently with higher voltage, so boosting voltage is usually a good thing – but know your system limits.
Solar Power Math : Generation
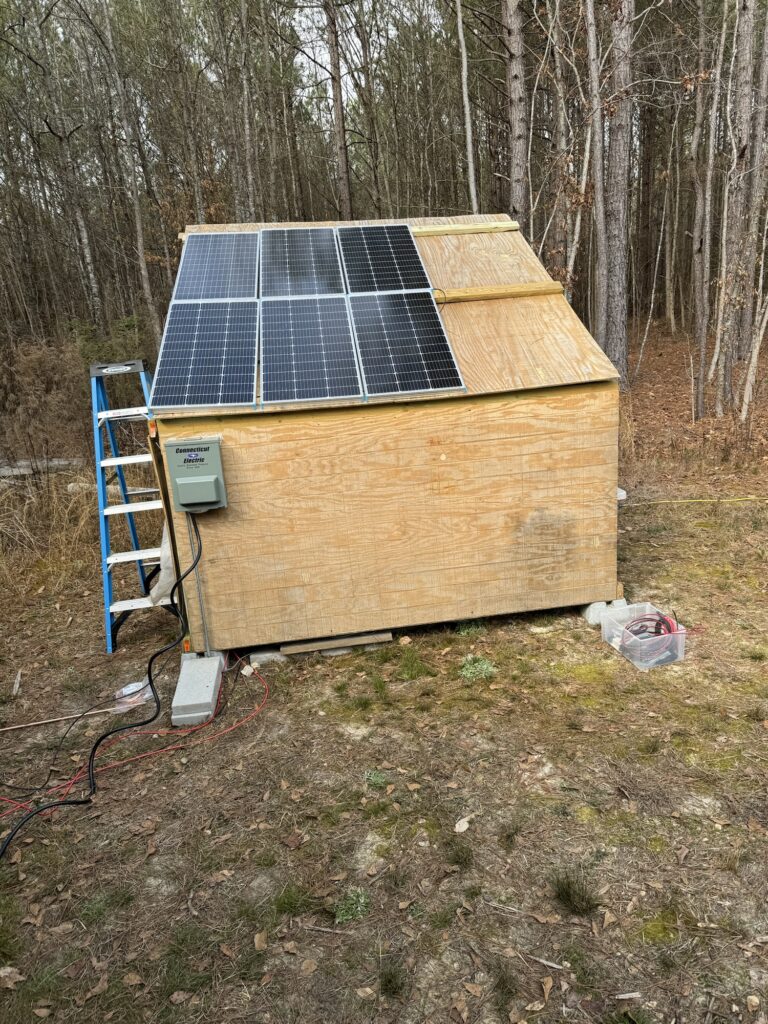
Our current system uses 6 panels.
Since our Renogy Charge Controller can handle 90 volts maximum, we want to make sure we stay below that but as close to that as possible.
Series Wiring
Wiring panels in series increases voltage, while amperage stays the same. 6 x 20.4 volts would mean 122.4 volts going to the charge controller. We don’t to blow it up, so let’s not do that.
Sidebar: series wiring means the first panel positive to controller, then negative to positive of next panel for all remaining panels, and the last panel leftover negative to the controller as well.
To have the system balanced and work properly we want to keep voltage and amperage close the same on each lead. Things tend to work more efficiently in balance in electrical systems. So we are going to split this into two groups of panels.
Panel Series A : 3 panels in series = 3 * 20.4 volts = 61.2 volts at 4.91 amps
Panel Series B : the same 61.2 volts at 4.91 amps
Parallel Wiring
But how do we connect two “strings” of panels to a single charge controller input? We have two positive terminals and two negative terminals at each end of the array. We connect them in parallel using a Y-Combiner Adapter. This takes two positive inputs and merges them into a single positive input. Same on the negative side.
Wiring panels in parallel increases the amperage while keeping voltage the same.
We have now combined Panel Series A + Panel Series B in parallel.
Our Generation Solar Power Math
Putting it all together, our solar panels wired as described have these characteristics:
61.2 volts (20.4 volts + 20.4 volts + 20.4 volts from the 3 panels)
9.82 amps (4.91 amps + 4.91 amps from the 2 strings of panels)
600.984 watts
All this is going into the charge controller, remember that is on a perfect sunny day with the earth as close to the sun as possible and every photon hitting every silicon imbalanced electron junction perfectly head-on.
A passing bird, a cloud, lots of clouds, or slightly off inclination of the panels will all lower these numbers. For example, some real world measurements:
Let’s dive into what the charge controller is doing with our solar output.
Generation Real World vs Theory
| Date | Weather | Solar Generation | Watts | Storage (12v) | Notes |
|---|---|---|---|---|---|
| 2024.02.27 15:40 | Rain | 0.17a 19.6v | 3.332 | .277666a | (4) 100w series optimal: 81.6v 4.91a (4) 100ah gel batteries |
| 2024.02.28 07:33 | Heavy Overcast | 0a | 0 | 0a | |
| 2024.02.28 08:48 | Overcast | 0.27a 23.8v | 6.436 | 0.535a | |
| 2024.02.28 12:00 | Light Overcast | 591.v 4.51a | 266.541 | 22.21175a | (3) 100w series x (2) parallel optimal: 61.2v 9.82a (4) 100ah gel batteries |
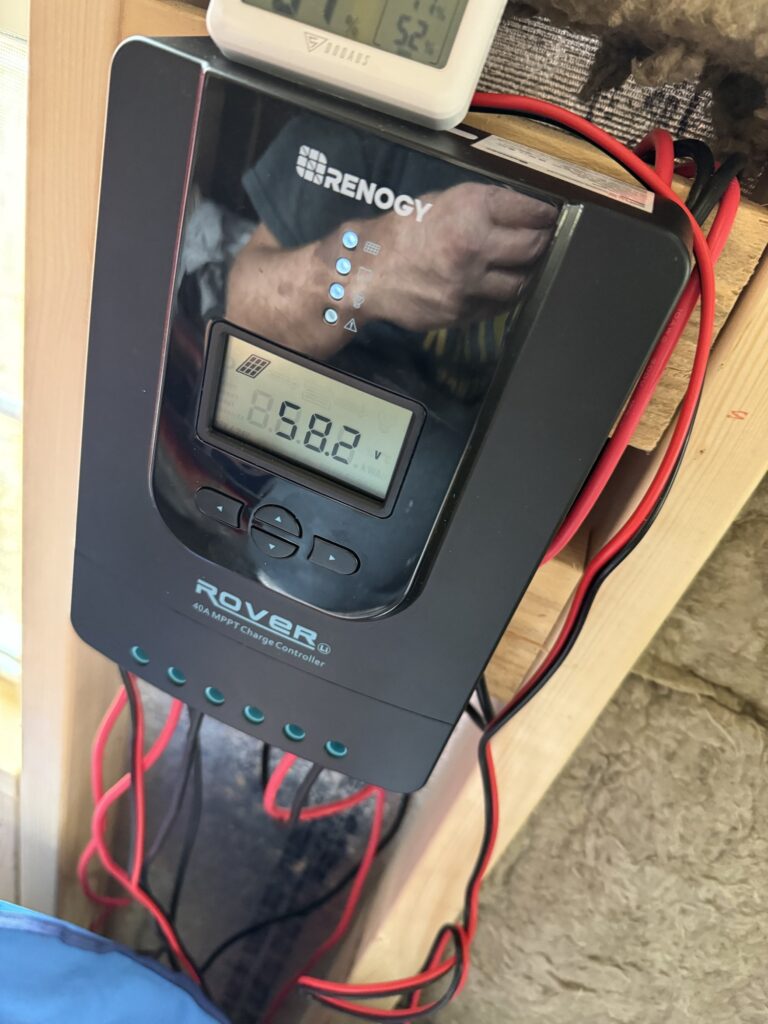
| 2024.02.28 12:15 | Partly Sunny, Sun | 58.2v 6.575a | 382.665 | 31.88875a |
From the table above you can see what kind of math the charge controller is dealing with. It takes highly variable input from the solar panels and pushes out a specific voltage of just over 12 volts to fill the battery as quickly as possible. At “peak sunshine” it is taking 58.2 volts running at 6.575 amps and dropping that voltage to 12 volts (about) adding almost 31 amps to the battery array per instance.
If this was steady for a full hour we would get almost 32ah added to our battery stack, refilling about 8% of the 400ah in one hour. Pretty sweet.
However you can also see that of our potential 600W of solar power generation, on a sunny day in late February (less than a month from equinox or “equal sun power”) we are getting 382 watts of power or just over 63% of the rated generation. Maybe in the peak of the stronger summer sun when the earth is tilted more toward that glowing orb in our hemisphere we can get closer to 75%? That would be sweet.
Seasonal Average Generation
The power generation is greatly impacted by weather so we need to make some assumptions until we get more real-world data points. We also need to account for daylight hours each season and peak sun each season.
Weather Impact
For sunny days we will assume 32A of power.
For inclement days we will 1A of power generation.
Weather Adjusted Power Output: ( 32A * (% sunny days / 100) ) + ( 1A * (1 – (% sunny days / 100) )
Using our fixed average of 66% Sunny Days for the entire year we get:
32A * 66/100 + 1A * (1 – (66/100) )
32A * 0.66 + 1A * (1 – 0.66)
32A * 066 + 1A * 0.34
~21A + ~ 0A
Weather Adjusted Power Output: 21A
Hours Of Peak/Off Peak Sun
For peak sun we will assume 100% power potential.
For off peak sun we will assume an average of 50% power potential.
The Solar Power math adjusted for peak and off peak sun and hours of sun/day comes out to:
Avg Power/Day = 1.00 * <Peak Sun> * <Weather Adjusted Power Output> + 0.50 * <Off Peak Sun> * <Weather Adjusted Power Output>
| Season | Peak Sun | Off Peak Sun | % Sunny Days | Avg Power/Day |
|---|---|---|---|---|
| Winter (Dec/Jan/Feb) | 4h | 6h | 66% | 1.00 * 4h * 21A = 84 ah + 0.50 * 6H * 21A = 63 ah 147 ah |
| Spring (Mar/Apr/May) | 6h | 6h | 66% | 1.00 * 6h * 21A = 126 ah + 0.50 * 6H * 21A = 63 ah 189 ah |
| Summer (Jun/Jul/Aug) | 7h | 7h | 66% | 1.00 * 7h * 21A = 147 ah + 0.50 * 7h * 21A = 73.5 ah ~220 ah |
| Fall (Sep/Oct/Nov) | 5h | 7h | 66% | 1.00 * 5h * 21A = 105 ah + 0.50 * 7h * 21A = 73.5 ah ~ 178 ah |
Solar Power Math : Storage
One of the primary jobs of the charge controller is to convert the highly variable amperage and voltage that flows out of the solar panels into steady usable energy that can fill up the batteries. Thus the “math of the charge controller” serves a critical role here.
To recap our Renogy RVR-40 electrical specifications:
Battery – Rated Current: 40A
Battery – Max Voltage: 32V
Solar – Max Input Voltage: 100V
Solar – Max Input Power: 12V @ 520W or 24V @ 1040W
Load – Rated Current: 20A
Consumption: 0.1A @ 12V or 0.058A @ 24V

Our system stores power in an array of 12 volt gel batteries, a good compromise for our system given weight, pricing, and temperature tolerance.
We have (4) 100 ah 12v gel batteries. Each battery holds 100 ah x 12v = 1200 wh or 1.2 kWh of power.
Our total storage:
4.8 kWh
400 ah at 12V
However, there is a catch they don’t tell you “in the marketing brochure” for gel batteries. It is recommended that a gel battery not be discharged below 50% capacity for long term battery health.
Sidebar: A main difference between lead-based batteries (seal lead acid, gel, or agm) and newer LiFePO batteries is the USABLE capacity. Lead-based batteries should only be discharged 50% of the way, leaving at least 34% (from our real world test) and safely 50% of the battery unused. LiFEPO batteries can be discharged safely to 80% and will recover from being discharged fully.
In fact both our Renogy RVR-40 and Renogy 2000W Inverter both stop allowing the batteries to release power when it reaches 36% state of charge. That means our USABLE POWER is 64% of the the rated battery capacity.
Our total USABLE storage (64%):
3.072 kWh
256 ah at 12v
Thankfully we are only powering Blue Skies Cabin which is a single 12×16 room bedroom (essentially) with minimal electrical load. By far our biggest load is that new mini split AC / heating unit we put in. More on that in a moment.
In comparison, our 1700sf 3 bedroom “on grid” home gobbles up an average of 37 kWH per day. Granted it charges our two EVs, one of which is used to commute every day, but to support our “every day lifestyle” would require 50 batteries to store that much power for a single day. Assuming 8 hours of sunshine each day, it would take 75 of our 100 watt panels with average sunshine to run our on grid home. Thats a lotta pizza!
Solar Power Math : Consumption
The final piece of the equation, consumption. Our current calculations include only 3 items that take power off our solar array: the mini split, the cooler (fridge), and the composting toilet fan. Here is how that all adds up.
Before we get into that part of the equation, we must note the details of the inverter. The Renogy 2000W inverter converts our 12 volt DC battery power into 120 volt pure sine wave AC power to run the cabin. However it runs at a claimed 90% efficiency, meaning anything in the cabin using AC power consumes 10% more power than it is rated for. The user manual for the inverter says to multiply loads by 1.25 = 25% which is quite far off from the claimed 10% losses — maybe they assume other losses from breaker boxes, length of cables, etc. but that is an extreme case in my opinion. Real world measurements will tell. For now we are going to do our math based on the 10% rated losses for AC items (the mini split) and round up to fudge the numbers more toward their bigger efficiency loss calculations.
We will also rate our biggest consumer, the mini split in heat mode which uses 1A more power than cooling and is the maximum load. However the calculations get complicated as it is the most variable use. In the summer, when we use the proeprty more, the cooling is needed far more during the day when the sun is fully out — it heats up the cabin way faster and general ambient air temps are higher, but that also means the solar panels are refilling the batteries quickly as well. During the late fall on a cloudy day the heat may run most of the day, but in this temperate zone setting the temp in the cabin at 65 and average daily temps not far from that the mini split may not run for most of the day, maybe two five minute cycles every hour.
The biggest draw from the mini split will be in the summer when it has been cooling on a regular cycle to keep the cabin at 78 degrees on a hot day. If we show up and push the temp down to 74 it may run for 30 minutes to reach that, then cycle on 5 minutes every 15. As such we will do the Solar Math based on that for a general “most likely use case” scenario but fudge that number higher by using the heating current (7a) vs. the 6a the cooling mode uses.
Let’s lay out our consumption table:
| Item | Consumption | % Runtime / Hour | Consumption/Day |
|---|---|---|---|
| Senville Leto 9000 BTU Mini Split (heat mode) | 7A 120VAC = 840W + 10% AC Conversion = 924W 924W from 12V battery = 77A | Most likely scenario… Drop from 78 to 74, 30m or 50% of 1h Run 5m of 15m to keep 74 for remaining 13h of summer day (33%) Run 5m of 20m (25%) for remaining 10h of night. | 77A * 0.50 * 1h + 77A * 0.33 * 13h + 77A * 0.25 * 10h — ~39 ah + ~330 ah + ~192ah = ~ 561 ah |
| Alpicool CF55 Cooler | 3A 12VDC | 5m every 15m = 0.33 (33%) | 3A * 0.33 * 24h ~ 24 ah |
| Nature’s Head Composting Toilet (fan) | 0.1A 12VDC | 1.0 (100%) | 0.1A * 1.00 * 24h ~3 ah |
Based on our above typical use the Blue Skies Cabin will be consuming about 588 Ah of power each day.
Solar Power Math Blue Skies Summary
Based on the above math, this is how our solar system turns out — in general the battery storage and solar array will be underpowered.
Thankfully we are in spring and nowhere near maximum usage. At this time of year (February) the mini split will barely run at all to maintain the 78 degree maintenance temp. In the next two months it will slowly ramp up, but in general the ambient air temp will be at or below 78 degrees meaning the mini split only needs to run to cool down from the radiant heat absorbed by being in direct sunshine. This also happens to be when the panels should be pushing maximum power generating 32A for 12 hours/day. We will have time to upgrade both the storage and generation components of the system.
Rally Creek Blue Skies Cabin Calculations
Average daily power generation winter: 147 ah
spring: 189 ah
summer: 220ah
fall: 178 ah
Total usable battery capacity (Feb 2024): 256 ah
Typical daily power consumption (summer): 588 ah
Peak Season (Summer)
At peak season (summer) the current math is showing we need to add solar capacity to refill the battery each day based on hours of peak sunshine and accounting for inclement weather. We will generate an average of 220ah daily but need 577ah each day. That is a shortcoming of 368 ah.
Each panel (we have 6) is averaging 36ah/day which means adding 10 more 100W panels for peak summer usage generating 576 ah/day. That also means 16 total panels, which fits nicely into our planned 4-panel series, creating a 4×4 array (4 parallel strings of 4 panels) pushing 81.6v at 19.64a optimal performance – a 1.6 kilowatt system.
To store that 588 ah at 64% maximum usable capacity requires 8 batteries total, adding 4 to the array bringing the storage capacity to 8.6 kilowatts (800 ah at 12v).
Conclusions From Blue Skies Solar Power Math
There are some caveats here with these assumptions on the size of the solar and battery array upgrades.
During the summer there is 14 hours of daylight with peak/off-peak sunshine. That leaves only 10 hours with zero power generation. That means we need full battery power for less time. Here our averages assume our batteries will be running down 33% of the time, or for about 2 days every week which is unlikely and need battery power to run all night.
In reality during the summer it rains or is cloudy on 33% of the days, but rarely all day, and usually just a few hours in the evening or late afternoon. Our inclement weather averages have a built-in assumption that the % of days with inclement weather lasts all day. Not a common occurrence at Rally Creek.
Our calculations also are based on “peak cooling” meaning a typical sunny warmer day at Rally Creek. We did NOT do the same inclement weather average reduction on the power consumption side of the equation where those rainy days, if they lasted all day, would not require less cooling. In reality they will. Not only that, the typical summer day will be mostly sunny all day at Rally Creek generating maximum solar power, with clouds rolling in in the late afternoon, cooling the cabin a little but even more so when it rains. The likely result is the batteries are full when the solar power stops generating and then the clouds and rain help cool the cabin making the mini split work less.
However, we do want to have a plan for “worst case”.
Our Action Plan
Overall the math shows we should perform some upgrades, but not rush them. As such our current plan remains solid –
Monitor the system and gather more real world data with our smaller system size we have installed now.
In a month or so, start of spring, add the two 100w panels to bring the total generation up to 800w with two 4-panel series. Alongside that upgrade, add two more 100ah gel batteries brining our capacity to 600ah (384 ah usable).
That plan will very likely get us through to at least the early summer months. We can then gather more real-world data and see if the caveats noted above about the sun-then-late-day-rain hold true.
After all, a big part of Rally Creek is learning new things and figuring out off grid and tiny home living — including how to do “Solar Power Math”.